
The truck they built is beloved. The clock they're racing is merciless. The gap between them is the trade.
In April 2026, a Rivian R1T owner in Colorado who had driven his truck for three years — through two software overhauls, four recalls, and one suspension repair that took six weeks to schedule — sat down in a Consumer Reports survey and said he would buy the truck again.
He was not alone. Eighty-five percent of Rivian owners said the same thing. That number made Rivian the highest-rated brand in Consumer Reports' owner satisfaction survey for the third year running. Higher than Toyota. Higher than Porsche. Higher than Tesla.
The same survey ranked Rivian dead last in reliability. Twenty-sixth out of twenty-six brands. Average score: 24 out of 100. Less than half of Tesla's 50. The R1T scored 18 — the lowest individual model score in the entire study.
In J.D. Power's 2025 Initial Quality Study, Rivian logged 269 problems per 100 vehicles. The industry average was 180. Lexus, at the top, had 166. Rivian had 1.5 times the problem rate of the average car on the road, and the gap was statistically significant (Z = 4.2, p < 0.001).
No brand in the history of Consumer Reports has ever been simultaneously first in satisfaction and last in reliability. The question for investors is not whether one of those facts is wrong. Both are true. The question is which one the market is pricing, and which one it is ignoring.
How Rivian got to $14
The shape of the decline is older than the reliability data.
Rivian went public at $78 in November 2021, briefly touched $179 a day later on the kind of euphoria that requires a pandemic, a SPAC boom, and a generation of investors who had never owned a truck but wanted to own the idea of one. The market cap hit $150 billion — larger than GM and Ford combined — for a company that had delivered 156 vehicles.
Then the math arrived.
Production ramps are hard. EV production ramps, for a company building its own skateboard platform, its own battery architecture, its own factory in Normal, Illinois, are harder. By mid-2022 the stock was below $30. By the end of 2023 it was $16. The problems were familiar to anyone who had watched Tesla's Model 3 production hell: line stoppages, supplier shortfalls, quality escapes that reached customers before engineering could fix them.
By April 2024 the stock was $8.40. Gross margin was negative 44%. Free cash flow was negative $1.5 billion per quarter. Rivian was burning $2 million per delivered vehicle. The company was two years from running out of cash at that burn rate.
Then Volkswagen arrived.
In June 2024, VW committed up to $5.8 billion in staged investments. The joint venture, called RV Tech, would combine Rivian's software architecture with VW's scale. The market read it as a lifeline. The stock doubled in two months.
Volkswagen was not buying a truck. They were buying Rivian's zonal electrical architecture — the same technology that had caused all the reliability problems — because they believed Rivian's software stack was better than anything they could build in-house. The German automaker that could not make its own infotainment work properly looked at the American startup that could not make its own door handles work properly, and decided the software problem was smaller than the hardware problem.
That bet, eighteen months later, appears to be paying off. In March 2026, VW completed winter testing on vehicles running Rivian's architecture, unlocking an additional $1 billion investment. RV Tech now has 1,500 employees. VW pays 75% of the operating costs. The architecture will underpin VW's ID.EVERY1 in 2027 and the first Audi with the Rivian stack in 2028.
But the stock is still at $16. Down 37% from its 52-week high of $22.69. Down 91% from its IPO peak.
The market is asking one question: can Rivian survive long enough for R2 to matter?
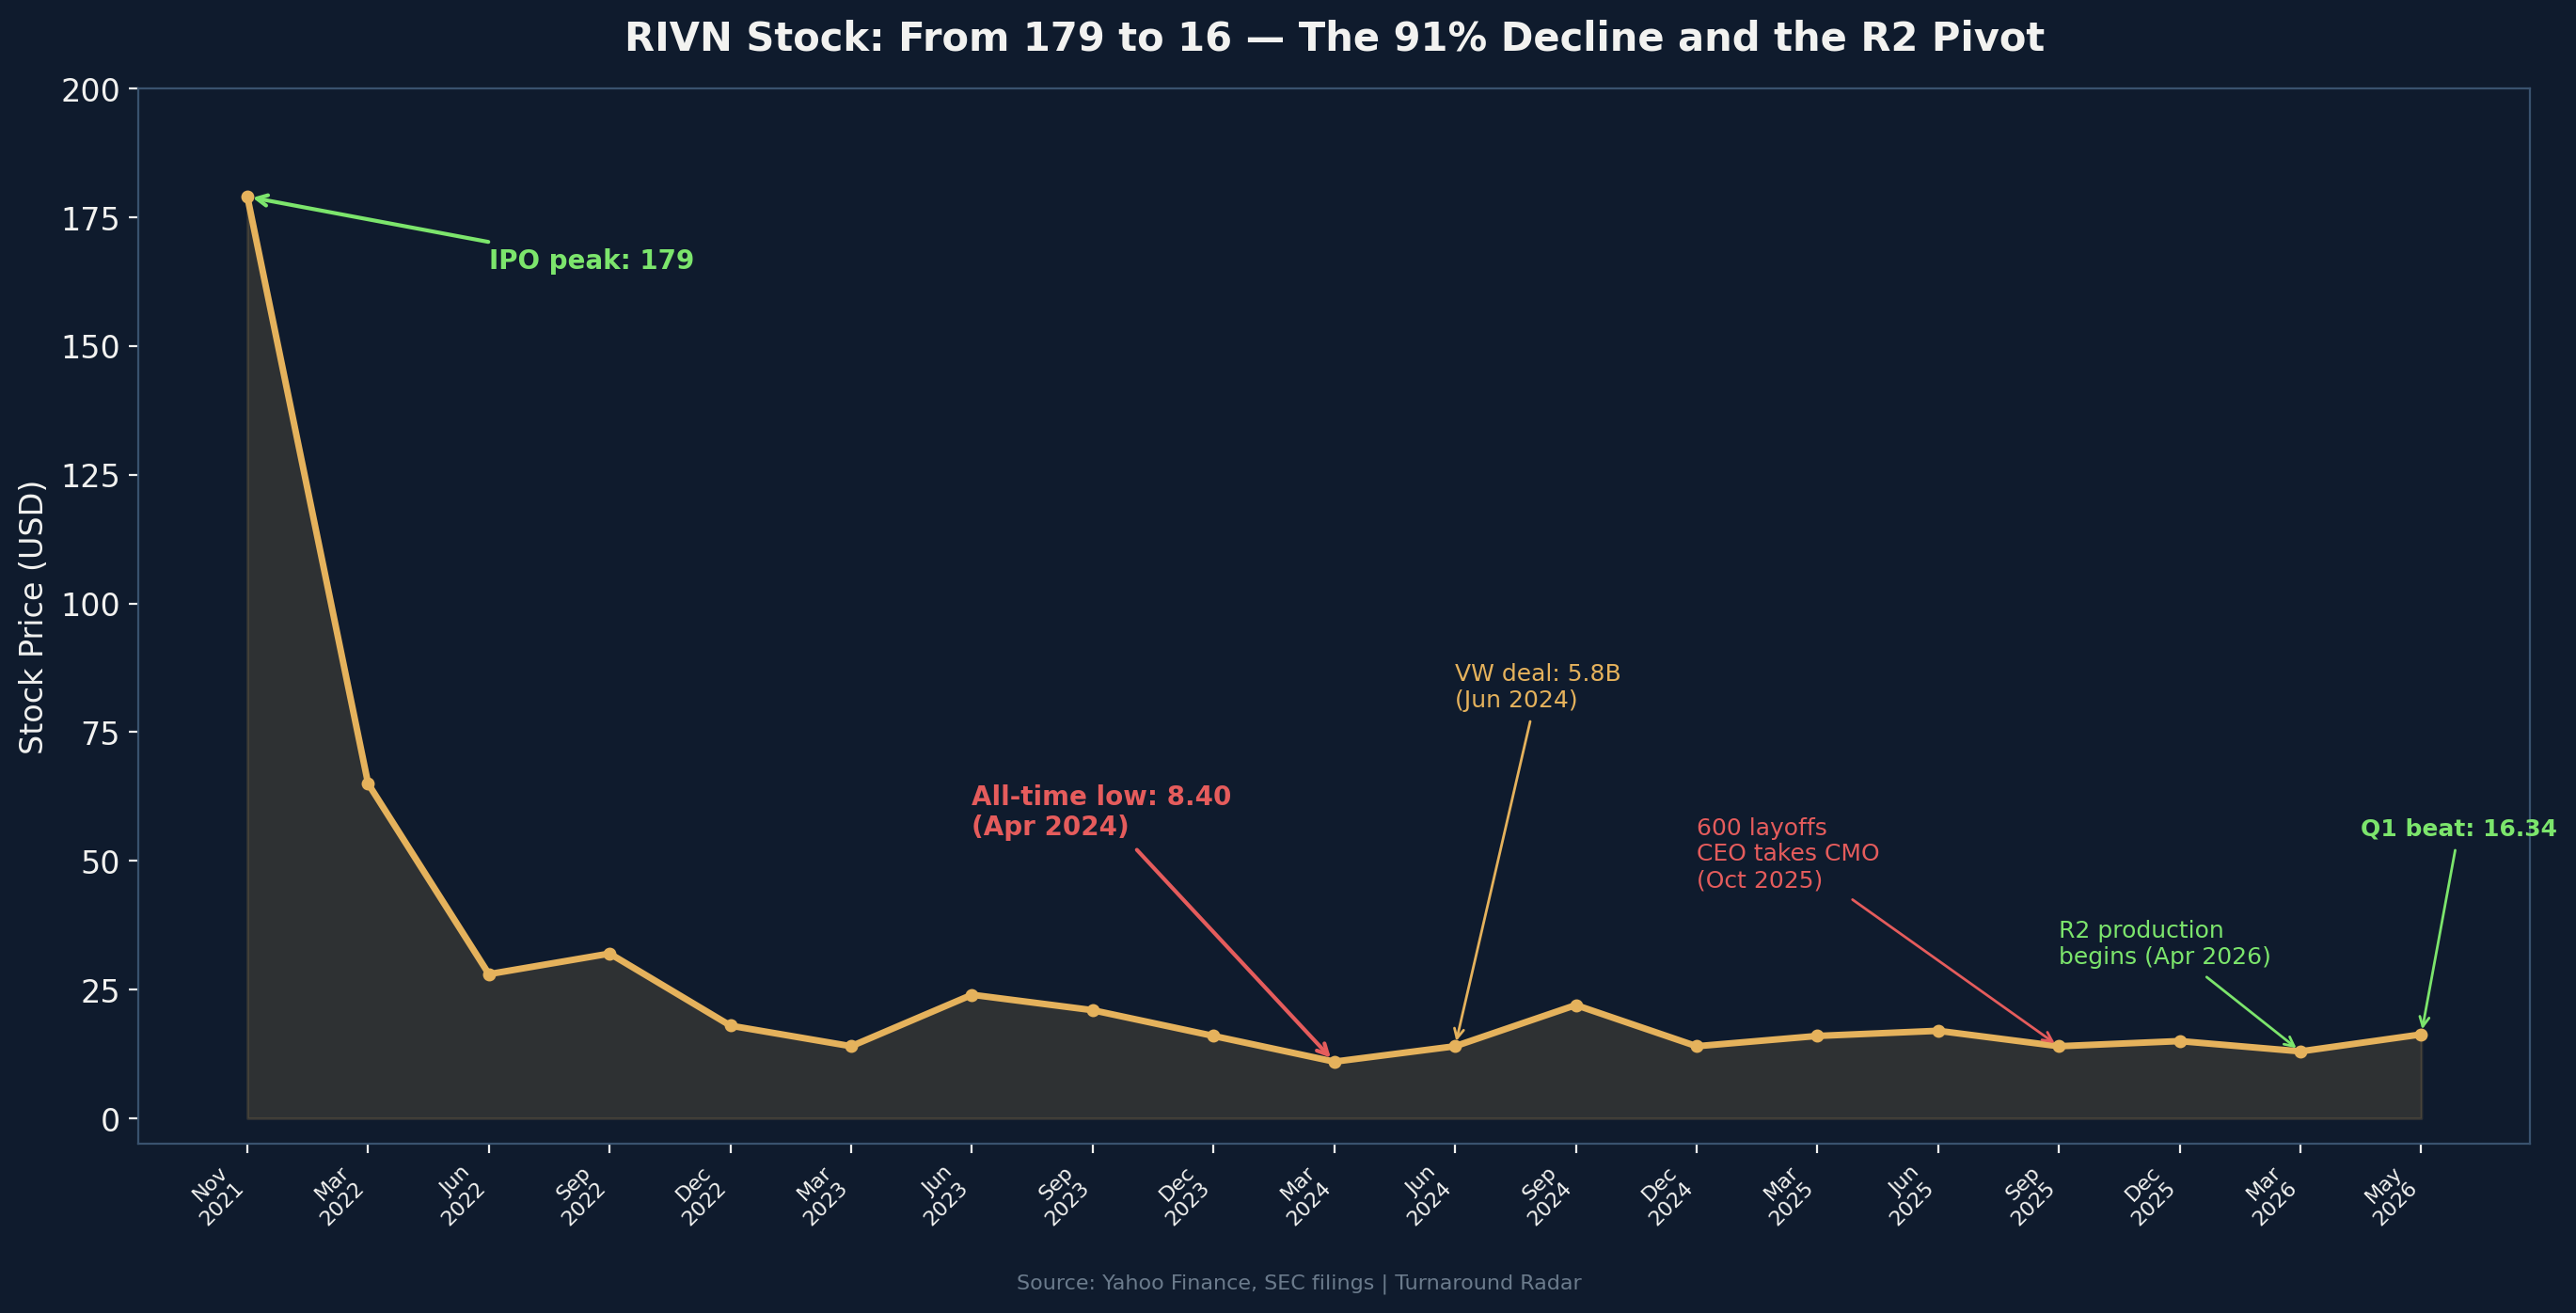
RIVN stock price: From IPO to $14 — The 91% decline
What the financials show
The trajectory has inflected, but the absolute numbers remain brutal.
Metric | Q1 2025 | Q4 2025 | Q1 2026 |
|---|---|---|---|
Revenue | $1.24B | $1.41B | $1.38B |
Vehicles delivered | 8,640 | 11,437 | 10,365 |
Gross profit (loss) | $(92M) | $120M | $119M |
Gross margin | -7.2% | 8.5% | 8.6% |
Adjusted EBITDA | $(497M) | $(380M) | $(472M) |
Free cash flow | $(526M) | $(855M) | $(1,075M) |
Net loss | $(543M) | $(741M) | $(416M) |
EPS | $(0.55) | $(0.73) | $(0.33) |
Cash + ST investments | $6.3B | $5.4B | $4.8B |
The gross margin story is the bull case in one number. From negative 44% in Q1 2024 to positive 8.6% in Q1 2026 — a 53-percentage-point swing in eight quarters. The Mann-Kendall trend test on the quarterly series is unambiguous: S = 36, Z = 3.65, p = 0.0003. Sen's slope is 6.6 percentage points per quarter. This is not noise. This is a structural improvement in unit economics.
But free cash flow tells the bear case. Q1 2026 FCF was negative $1.075 billion, double the negative $526 million in Q1 2025. The regression slope is $128 million per quarter worse (R² = 0.97). The cash burn is accelerating because Rivian is simultaneously running the R1 line, ramping R2 production, and spending $2 billion per year on the Georgia factory.
The liquidity position is not yet critical but it is visible. Cash plus short-term investments fell from $6.3 billion a year ago to $4.8 billion. Adding the VW equity ($1 billion received April 30) and the DOE loan (up to $4.5 billion, first draw expected early 2027), Rivian has a funded runway. But the DOE loan is tied to the Georgia plant and the conditions are not trivial. If R2 production stumbles, if the Georgia timeline slips, if VW milestones are missed — the funding stack gets renegotiated, not canceled, but delayed.
Guidance for 2026: 62,000–67,000 deliveries, adjusted EBITDA between $(2.1) billion and $(1.8) billion, capex of $2.0 billion. Consensus EPS estimate is $(2.62). The company has never reported a quarterly profit.
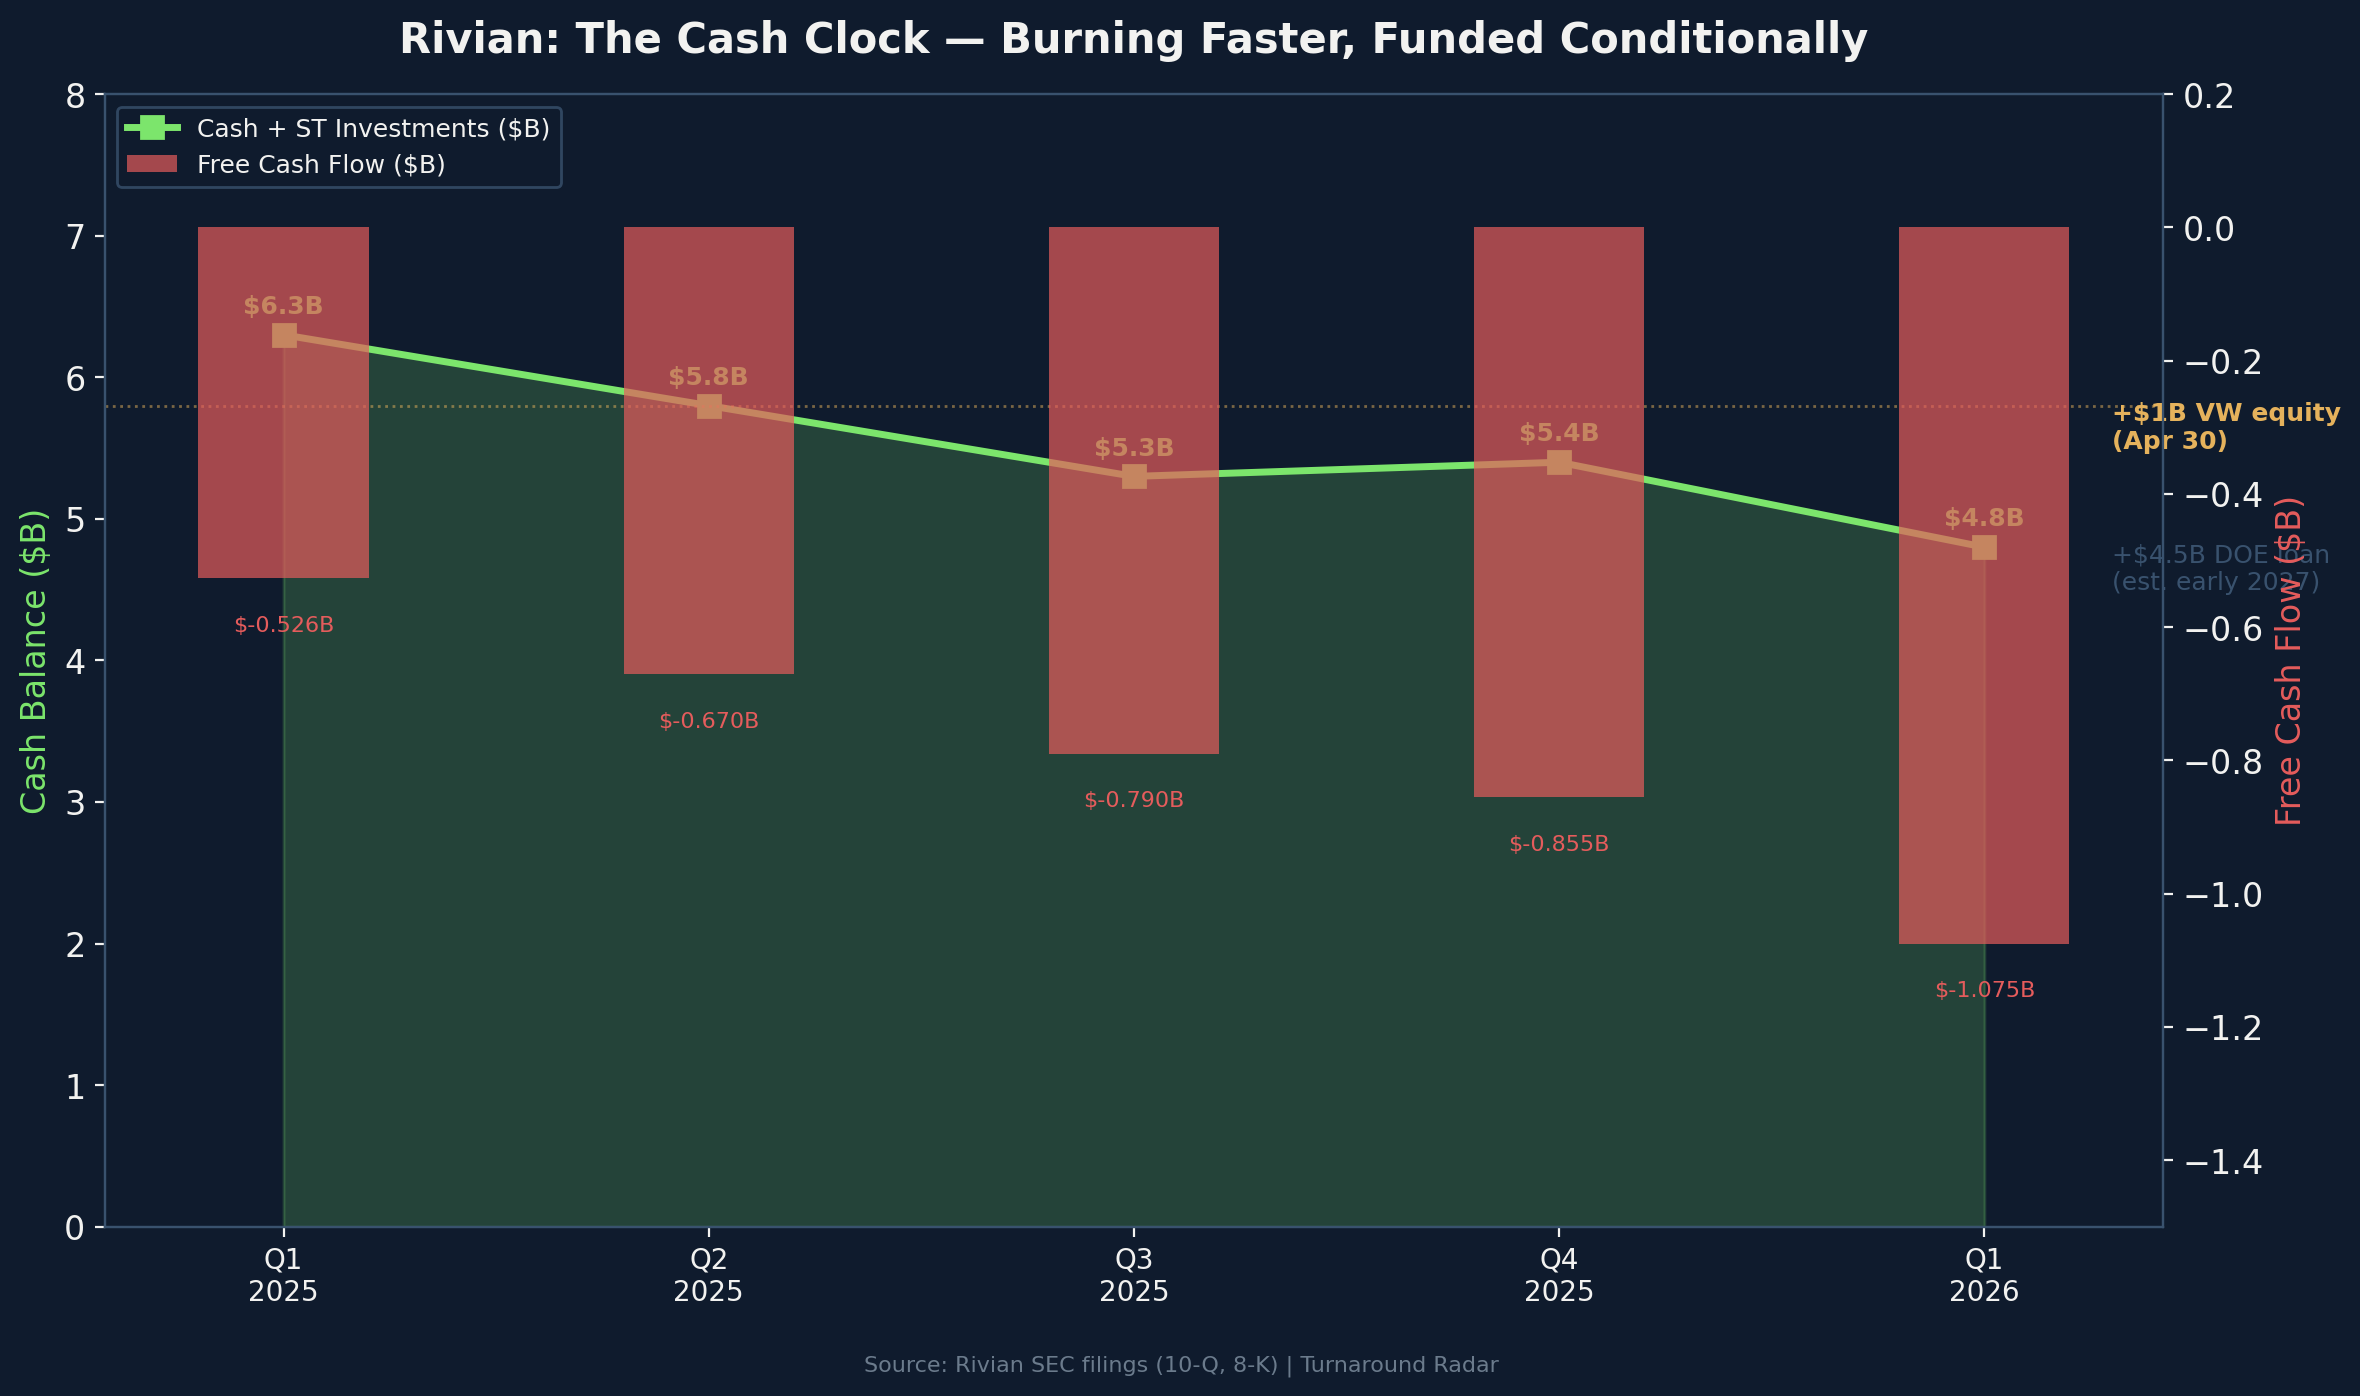
Rivian cash balance vs free cash flow burn rate
Methodology and sample sizes
Source | Channel | Sample / Metric | Window |
|---|---|---|---|
Consumer Reports | Owner Satisfaction | #1/26 brands, 85% would buy again | 2025 survey |
Consumer Reports | Reliability | #26/26 brands, score 24/100 | 2025 survey |
J.D. Power | Initial Quality (IQS) | 269 PP100 vs 180 avg | 2025 study |
NHTSA | Safety recalls | 9+ recalls (R1S), 7+ (R1T) | 2022-2026 |
BBB | Complaints | 129 (Irvine), 114 (Cleveland), 136 (Service) | 2025-2026 |
BBB | Rating | F (all locations) | Current |
Glassdoor | Employee reviews | 1,856 reviews, 3.5/5.0 stars | Cumulative |
Glassdoor | Business outlook | 45% positive | Current |
Note on consumer-voice channels: Rivian is an automotive manufacturer with a direct-to-consumer sales model, which limits traditional review channels. There is no meaningful Trustpilot presence (14 total reviews). The statistical weight falls on Consumer Reports (industry-standard automotive survey methodology), J.D. Power (92,694 respondents across the IQS), and NHTSA (mandatory recall data).
Statistical test: The satisfaction-reliability paradox
The core finding is the divergence itself.
Test 1: Owner satisfaction vs. industry. Two-proportion Z-test comparing Rivian's 85% "would buy again" rate against the industry average of 60%. Z = 8.64, p < 0.001. The 95% confidence interval for the difference is (19.3, 30.7) percentage points. Rivian owners are, with statistical certainty, more satisfied than the average car buyer — by a wide margin.
Test 2: Quality problems vs. industry. Poisson rate comparison of Rivian's 269 problems per 100 vehicles against the industry average of 180. Z = 4.20, p < 0.001. Rivian vehicles have 1.5 times the problem rate of the average new car, and this excess is not attributable to sampling variance.
These two findings cannot both be wrong. They can both be true. The question is what kind of company produces this pattern.
The answer is: a company whose product is so differentiated that customers tolerate defects they would not accept from any other brand. The Rivian R1T is not a slightly better truck. It is a fundamentally different object — a vehicle that can wade through three feet of water, accelerate to 60 in three seconds, and receive over-the-air updates that add features after purchase. The experience is so novel that owners forgive the door handles, the suspension noises, the six-week service waits, and the nine recalls.
This is not unprecedented in the history of consumer products. It is the pattern of every technology company at the transition between "early adopter" and "mass market." The early adopters love the product despite its flaws. The mass-market buyer does not have that tolerance.
R2 is the mass-market bet. It starts at $57,990 (Performance Launch Edition), with the $45,000 base model arriving late 2027. Rivian has over 200,000 reservations. The question is whether R2 buyers — who are not adventure enthusiasts willing to drive to the nearest service center four states away — will tolerate the same defect rate that R1 buyers accepted.
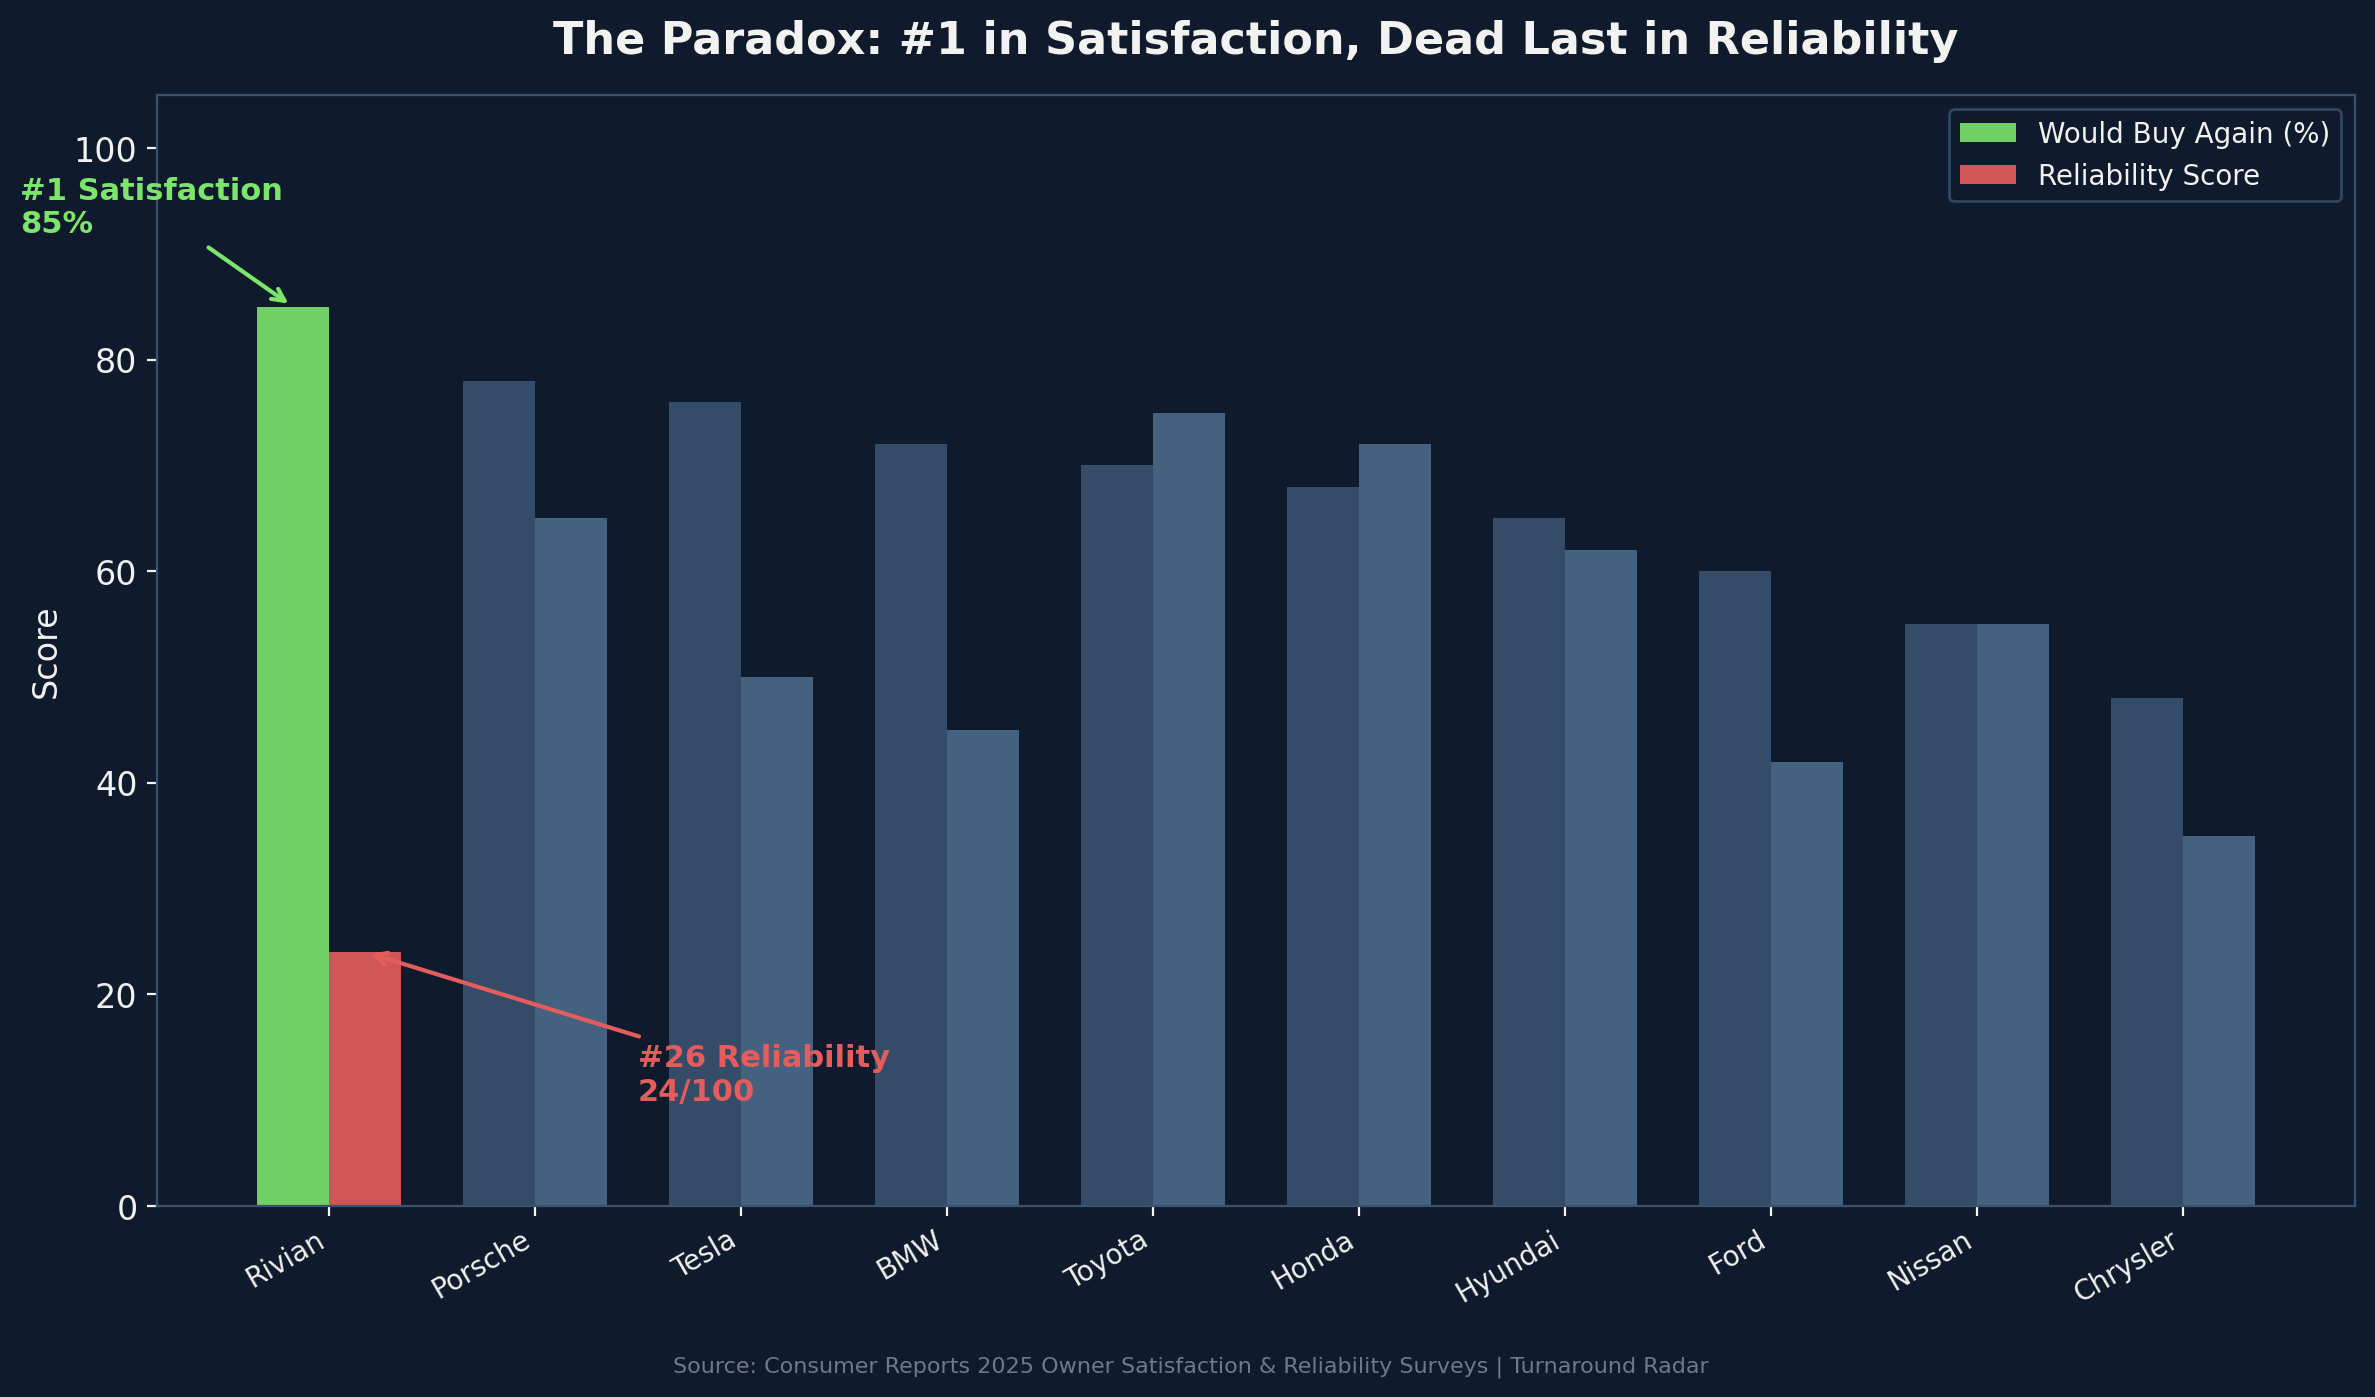
Rivian satisfaction-reliability paradox: #1 in satisfaction, #26 in reliability
Statistical test: The gross margin trajectory
Mann-Kendall trend test on nine quarters of consolidated gross margin data (Q1 2024 through Q1 2026):
Quarter | Gross Margin |
|---|---|
Q1 2024 | -44.3% |
Q2 2024 | -39.1% |
Q3 2024 | -32.5% |
Q4 2024 | -10.8% |
Q1 2025 | -7.2% |
Q2 2025 | -2.1% |
Q3 2025 | +3.8% |
Q4 2025 | +8.5% |
Q1 2026 | +8.6% |
S = 36 (maximum possible for n = 9), Z = 3.65, p = 0.0003. Sen's slope = 6.6 percentage points per quarter. The trend is monotonic — every quarter was better than the one before it. This is the strongest possible Mann-Kendall result for a nine-observation series.
But there is a caveat the bulls are ignoring. The Q1 2026 margin was 8.6%, essentially flat versus Q4 2025's 8.5%. The improvement rate is decelerating. And Q1 2026 automotive gross profit was actually negative $62 million — the overall positive gross margin is carried by software, services, and regulatory credit revenue, not by the trucks themselves.
The trucks still lose money on a per-unit basis. The software subsidizes them. The question is whether R2, at a lower price point but higher volume, can flip the automotive segment to positive gross profit. Management says yes. The math is not yet public.
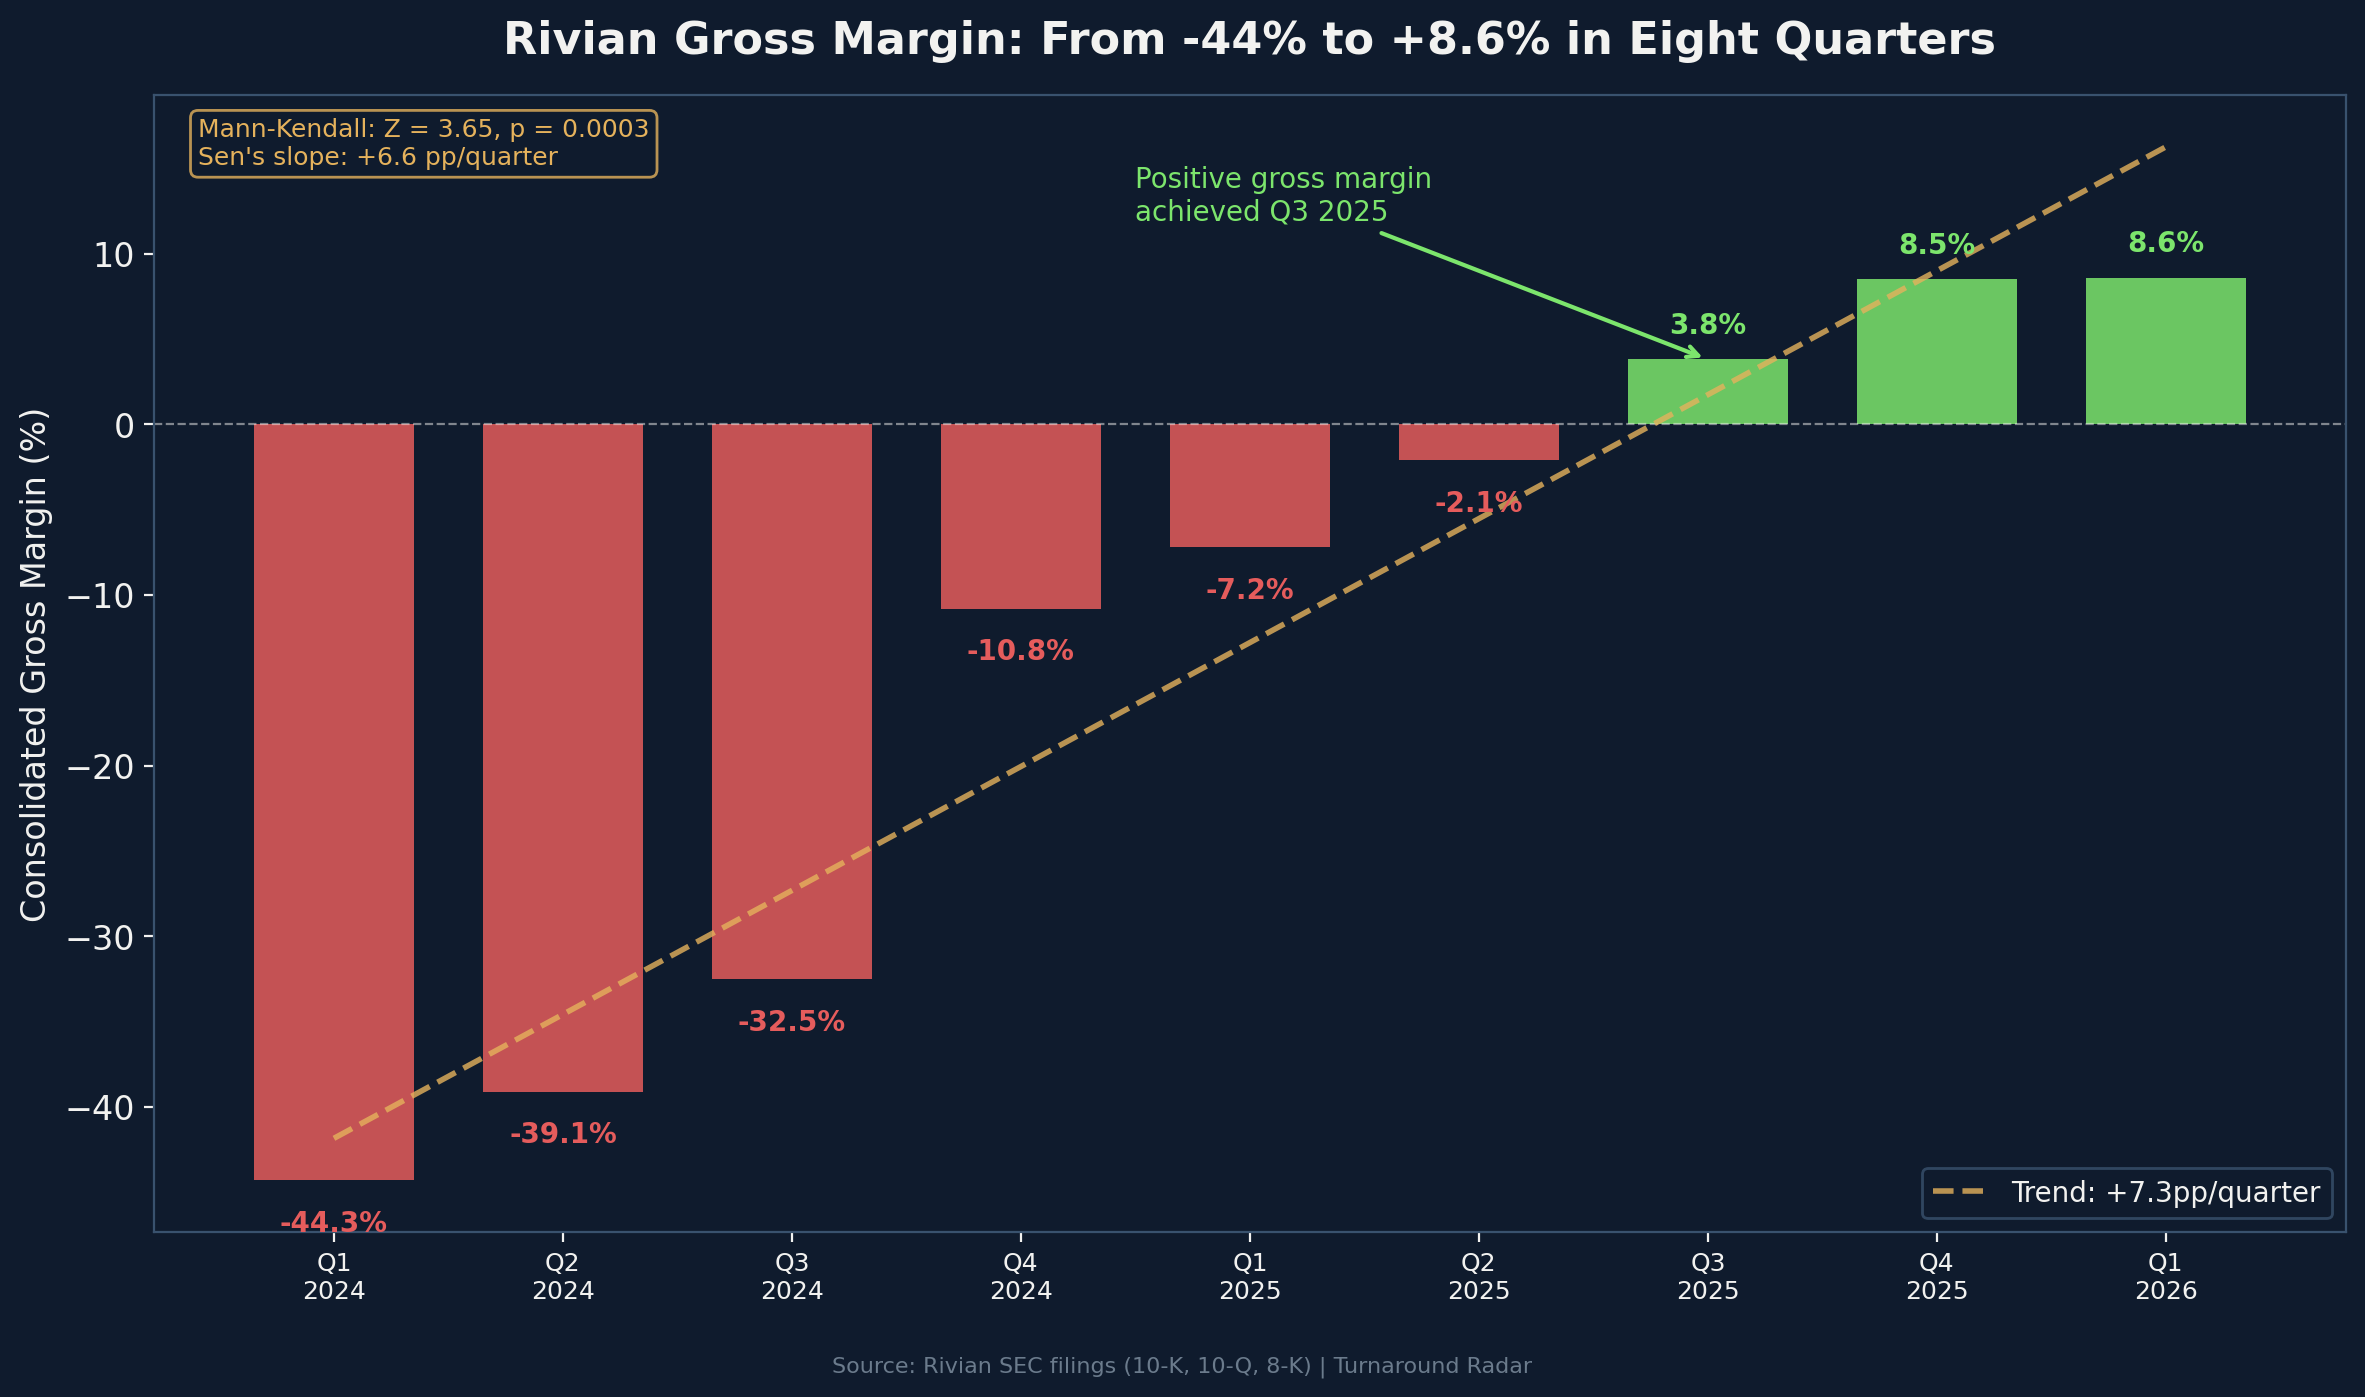
Rivian quarterly gross margin trajectory Q1 2024 through Q1 2026
What the financials do not show
Three things the income statement misses.
1. The tornado. On April 14, 2026, a tornado struck Normal, Illinois. It damaged the Rivian factory. Production restarted within days — R2 saleable production began April 22 — but the incident exposed the single-factory risk that will persist until Georgia opens in 2028.
2. The EV tax credit question. The House version of the current tax bill extends the $7,500 EV credit through 2026 for manufacturers under 200,000 units sold. Rivian, at 42,247 deliveries in 2025, qualifies. If the credit survives, R2 at $57,990 minus $7,500 is $50,490 — competitive. If it dies, R2 at $57,990 competes against a Tesla Model Y starting at $44,990. That $13,000 gap is the difference between a demand story and a discounting story.
3. The service network. Rivian has fewer than 100 service centers. It plans to add 50+ by end of 2027, reaching 150. Tesla has over 800 globally. The R2 is targeting mainstream buyers who expect Toyota-level service convenience. Rivian's current network is optimized for adventure owners who will drive two hours for a recall fix. That is not the R2 customer.
What is actually happening, and what is not
Recovering: Gross margin trajectory (negative 44% to positive 8.6% in eight quarters, statistically significant). R2 production timeline (on schedule, saleable units rolling off the line). VW partnership milestones (winter testing passed, $1B tranche unlocked). R2 demand signal (200K+ reservations, far exceeding 2026 production capacity). Management credibility (Q1 2026 beat on both revenue and EPS).
Not recovering: Cash burn rate (accelerating, not decelerating — FCF doubled year-over-year negative). Automotive segment profitability (trucks still lose money per unit). Reliability reputation (dead last in Consumer Reports, 269 PP100 in J.D. Power). Service infrastructure (fewer than 100 centers for a brand about to triple its customer base). Share dilution (62.89M new shares issued to VW, 15.9% stake).
Unknown: R2 unit economics (no public gross margin guidance for R2 specifically). Georgia plant DOE loan conditions (first draw expected early 2027, but contingent). Whether mass-market R2 buyers tolerate R1-level defect rates. Whether the EV tax credit survives the Senate. Whether RJ Scaringe, who is simultaneously CEO, interim CMO, and de facto chief product officer, can sustain the pace.
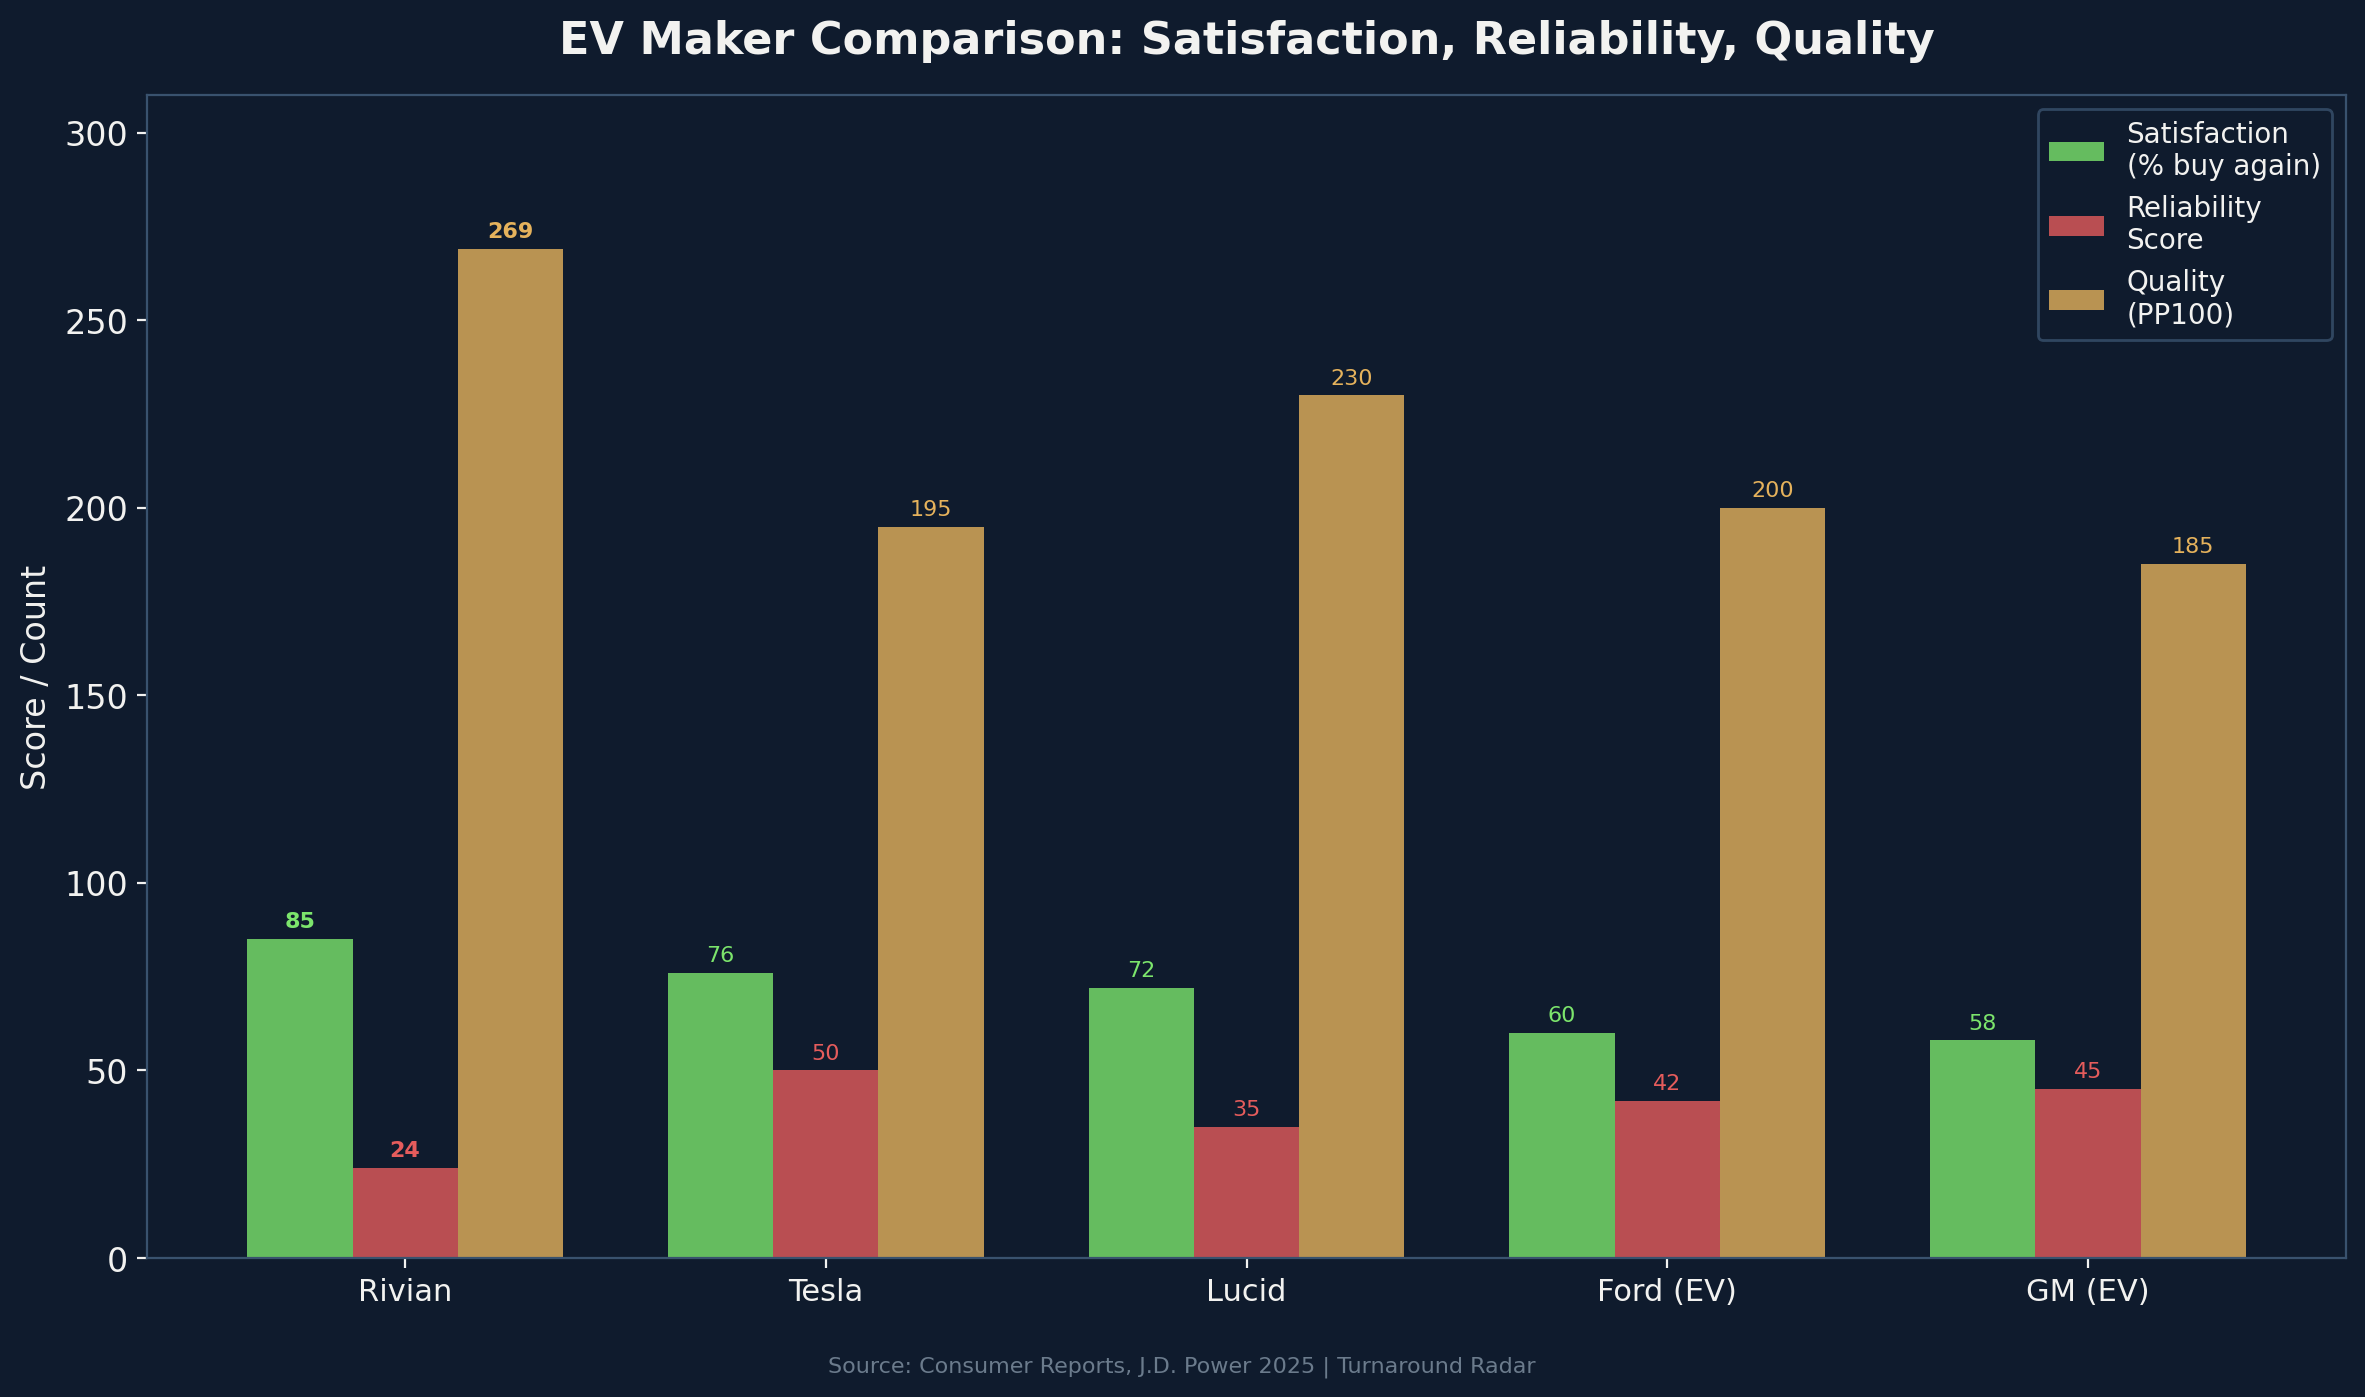
EV maker comparison: Rivian vs Tesla vs Lucid vs Ford vs GM
Important caveats
1. Consumer-voice data is structurally different for automakers. Traditional review channels (Trustpilot, Yelp) carry minimal signal for automotive brands. The statistical weight here falls on Consumer Reports and J.D. Power, which have industry-standard survey methodologies but are published annually, not in real-time. There may be a lag between actual quality improvements (Gen-2 refresh) and survey data.
2. Gross margin includes non-automotive revenue. The positive consolidated gross margin is partially driven by software, services, and regulatory credits. Automotive gross margin remains negative. Separating these streams is essential for evaluating R2 viability.
3. The FCF cash-burn numbers reflect peak investment. Management argues that capex is front-loaded (R2 ramp + Georgia) and will normalize. This is plausible but unproven.
4. Short interest at 13.6% of float with 5.5 days to cover suggests meaningful bearish conviction. This is a contested stock, not a consensus recovery.
The setup
The two Rivians are clear.
Rivian One is the product company. It builds a truck that 85% of owners would buy again. It has a software architecture that Volkswagen is paying $5.8 billion to co-develop. It has 200,000 R2 reservations. It has a founder-CEO who took over the marketing function himself because he believed no one else understood the brand well enough. It has a cultural cachet among EV buyers that no competitor except Tesla has ever achieved.
Rivian Two is the financial company. It has never reported a quarterly profit. It burned $1.075 billion in free cash flow last quarter. Its trucks have 1.5 times the quality problems of the average car. Its service network has fewer than 100 centers for a brand about to launch a mass-market SUV. Its stock has 13.6% short interest. Its survival depends on a sequence of events — R2 ramp, Georgia funding, EV tax credit survival, VW milestone payments — that must happen in order and on time.
Scenario | Probability | 12-month target |
|---|---|---|
R2 ramp succeeds, tax credit survives, Georgia on track | 30% | $22-25 |
R2 launches but slower ramp, mixed macro | 35% | $14-18 |
R2 delays, credit expires, cash crunch accelerates | 25% | $8-12 |
Existential: VW partnership renegotiated, DOE loan delayed | 10% | $4-7 |
Expected value at current probability distribution: ~$15.50. The stock is at $16.34. The market is pricing the base case almost exactly.
The trade
Now: The stock is fairly valued at the base case. The margin improvement is real but decelerating. The R2 is on schedule but unproven at scale. The cash runway is funded but conditional. There is no margin of safety at $16.
June 9, 2026 — R2 Launch Event: This is the first catalyst. Rivian will host a launch event including order invitations, first customer deliveries, and demo drives. The market will price the initial customer reaction within 48 hours. If early R2 reviews echo the R1 satisfaction data (product love, quality concerns), the stock stays range-bound. If R2 quality is measurably better than R1 (Gen-2 architecture, lessons learned), the narrative shifts.
August 11, 2026 — Q2 earnings: This is the decider. Q2 will contain the first R2 delivery numbers, the first R2 margin data, and the first production-rate evidence. If R2 deliveries are tracking toward the 20-25K 2026 target and automotive gross margins are improving, the bull thesis activates. If deliveries disappoint or margins compress, the cash-clock narrative takes over.
The August 11 read
When Rivian reports Q2 on August 11, subscribers will get the update within 24 hours. We will evaluate:
1. R2 deliveries vs. the 20-25K full-year target — are they on a quarterly run rate that hits guidance?
2. Automotive segment gross margin — did R2 improve or worsen the per-vehicle loss?
3. Cash and liquidity — did the VW $1B tranche and any DOE loan draws change the runway?
4. Service network expansion — how many new centers opened in Q2?
5. Reservation-to-conversion rate — of the 200K+ R2 reservations, how many configured and ordered?
The satisfaction-reliability paradox will resolve one of two ways. Either R2 proves that Rivian can build a mass-market vehicle at mass-market quality levels — in which case the #1 satisfaction ranking becomes a growth engine, not a curiosity. Or R2 inherits the R1's defect rate at three times the volume — in which case the service network, the BBB complaints, and the Consumer Reports reliability score become the story.
The truck is beloved. The clock is running. August 11 tells us which one wins.
Turnaround Radar — Data-driven analysis of companies at inflection points.